Discover comprehensive insights into your company’s performance by navigating to the Overall tab within the Insights section on the left menu.
Overall Performance Graph
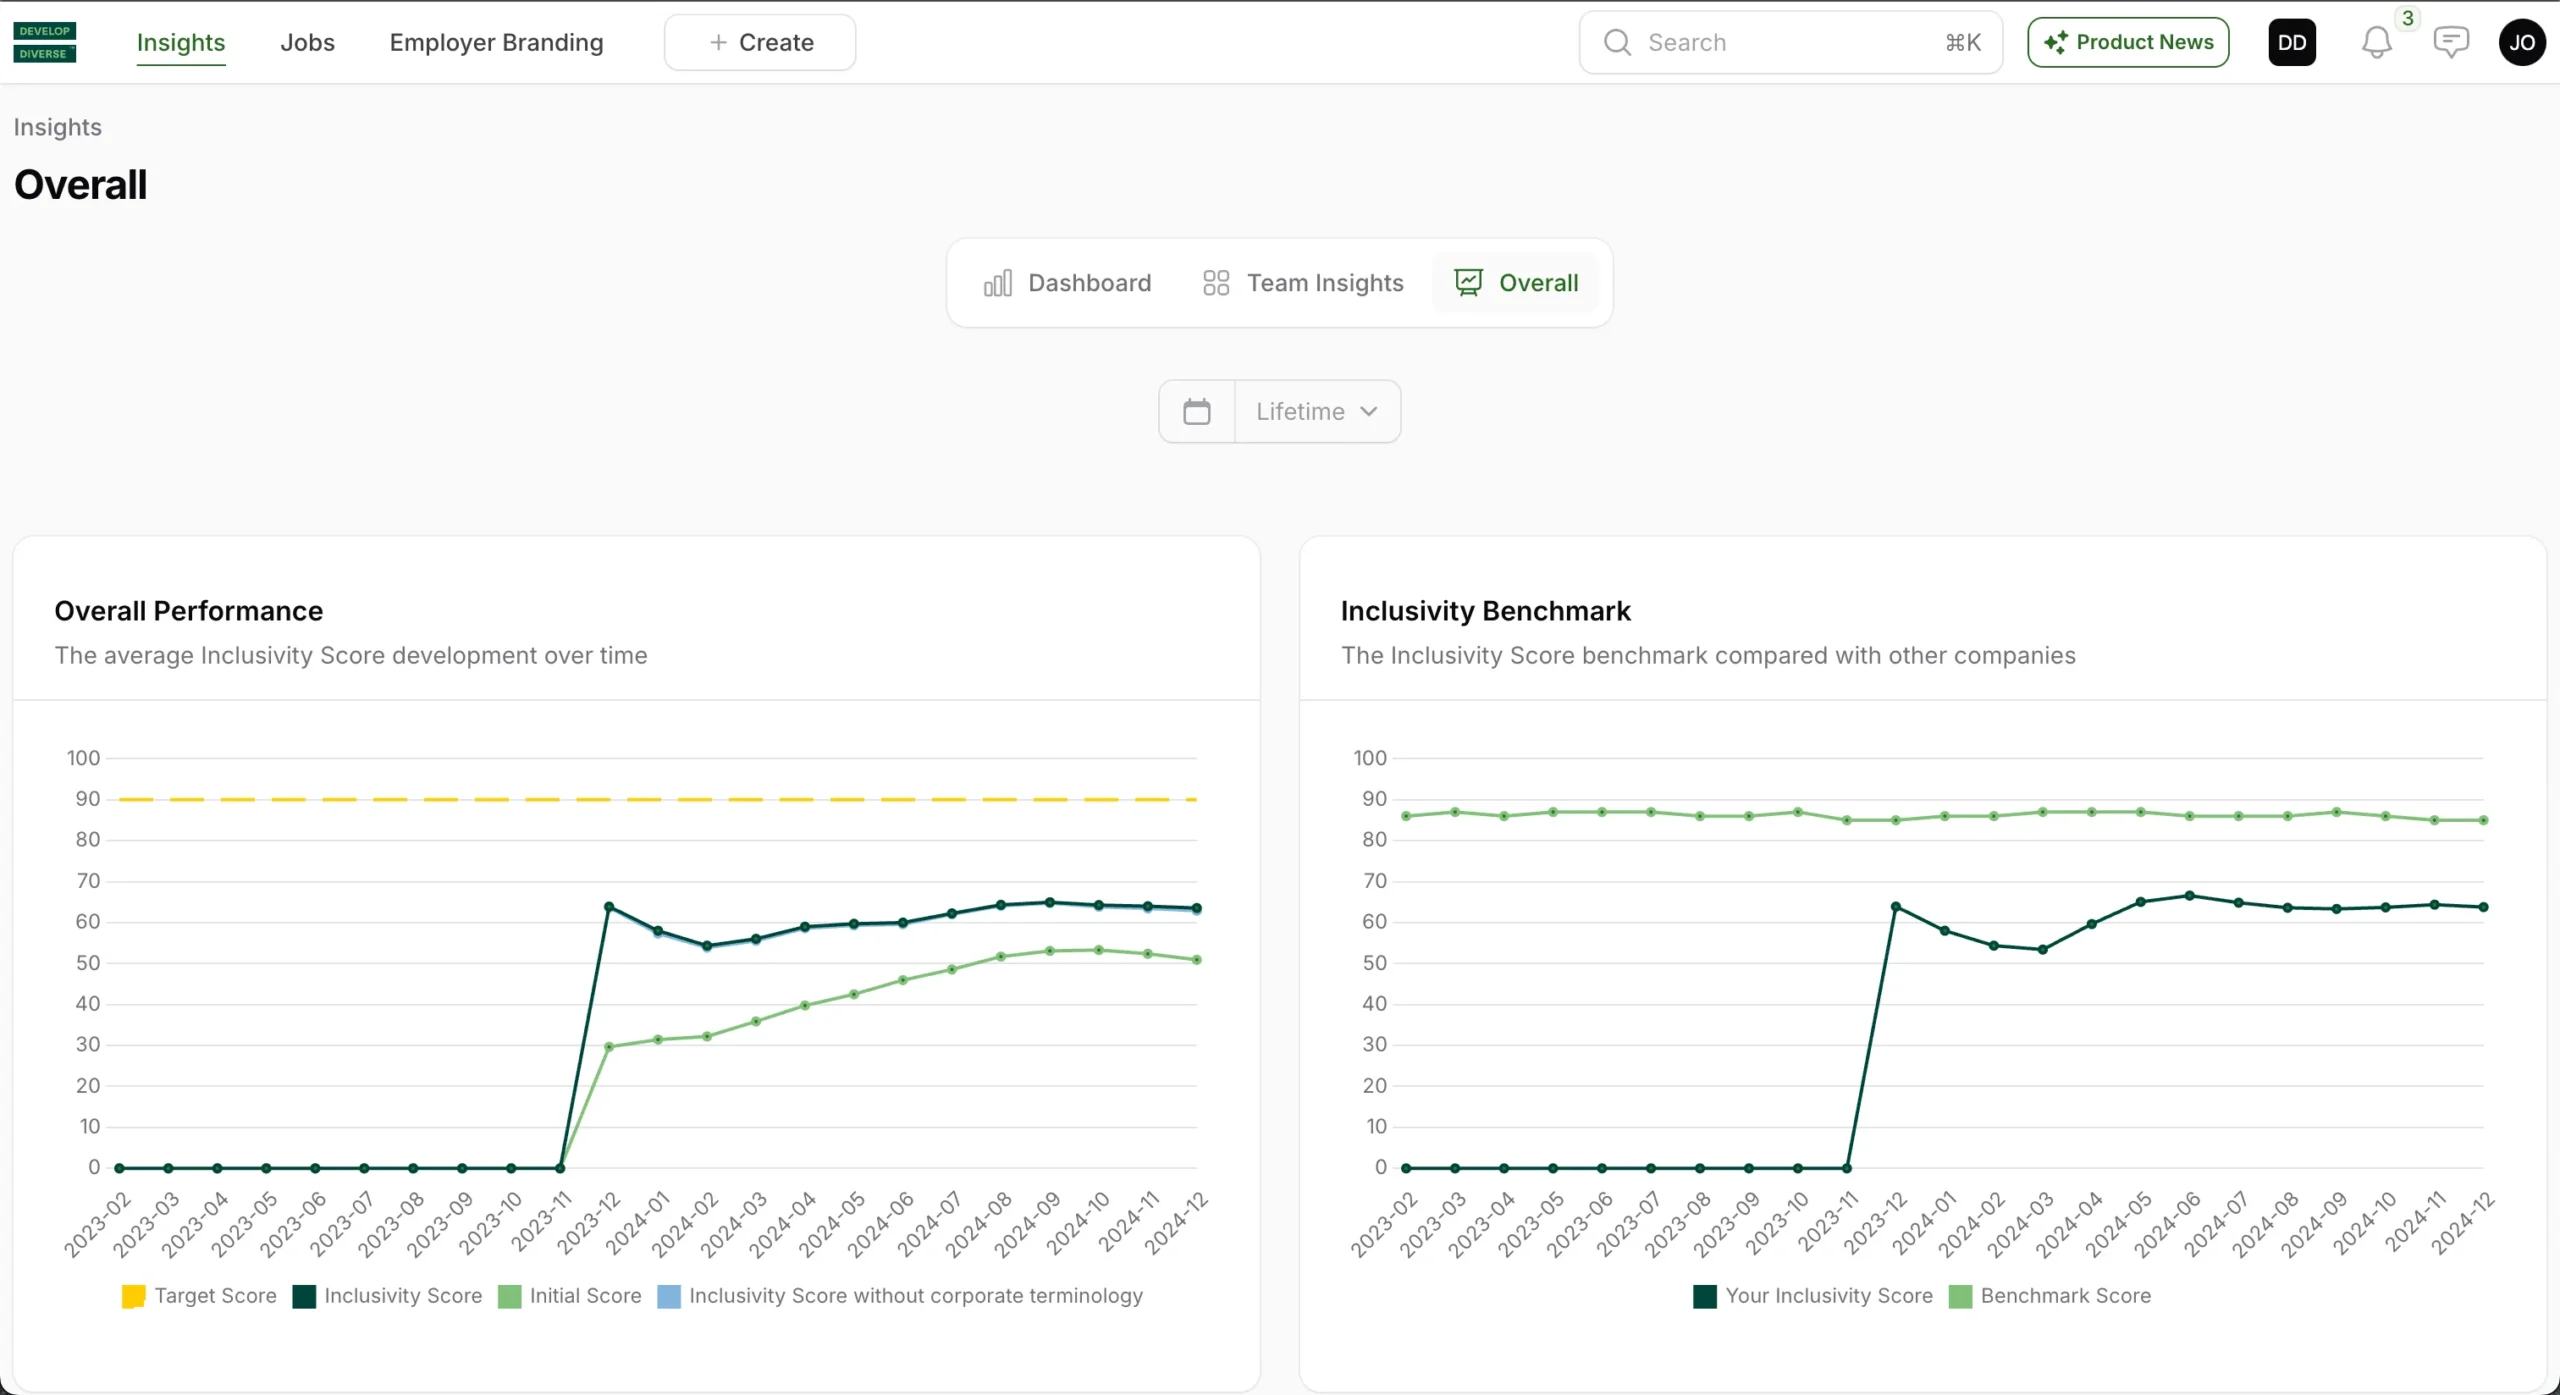
This graph illustrates your company’s inclusivity score performance:
- Target Score (Yellow): Your company’s inclusivity target score. Aim to have all published entries above this target.
- Inclusivity Score (Dark Green): The score after adjusting biased words in your text. Aim to surpass the target score (yellow line).
- Team Score (Purple): The average inclusivity score of your team’s entries. Aim to exceed the target score (yellow line).
- Initial Score (Light Green): The average inclusivity score of your text entries before adjustments.
Inclusivity Benchmark
In this graph, the average inclusivity score of your company over time is represented in dark green. The light green is the benchmark score, showing the average inclusivity score by all Develop Diverse customers. This allows you to compare how you are performing in comparison with other Develop Diverse customers.
Experience Level Performance
A bar chart offering insights into your team’s performance compared to other Develop Diverse customers and other teams in your company per seniority level of job ads.
- Your Average Inclusivity Score (Light Green): The overall inclusivity score of job ads per seniority level for your company.
- Your Team Score (Purple): Your team’s average inclusivity score of job ads per seniority level.
- Benchmark Score (Dark Green): The average inclusivity score of all Develop Diverse customers per seniority.